Plot Passes on a Pitch
Example shows how to plot passes on a pitch using the 'ballMovement' type of Rabona.layer.
Ball movement layer is a special type of layer that plots passes and shots on a pitch. It is a good way to visualize the ball movement of a team or a player.
We will start with the Rabona import.
Import Rabona and initiate the pitch
We will use the same techinque as in the previous example to import Rabona and initiate the pitch.
import Rabona from "rabonajs";
import { useEffect, useRef, useState } from "react";

export const PitchComponent = () => {
  const [pitch, setPitch] = useState(null);

  const pitchOptions = {
    height: 80, //in px
    width: 120, //in px
    padding: 100, // in px, distance between the pitch border lines and external border
    linecolour: "#ffffff",
    fillcolour: "#7ec850",
  };

  useEffect(() => {
    if (!pitch) {
      const pitch = Rabona.pitch("pitch", pitchOptions);
      setPitch(pitch);
    }
  }, []);

  return <div id="pitch" style={{ width: "500px", margin: "auto" }} />;
};
Pitch Size
Different stadiums have different sizes in real world. Moreover, different data providers might serve their data in different coordinate system. In the next couple of examples we are going to use statsbomb data so we will create the pitch accordingly. Thankfully Stasbomb provides a standard for that in their documentation. For instance WyScout data is in a different coordinate system.documentation The pitch size is defined by the width and height properties of the pitch. Top left corner is the origin of the coordinate system.
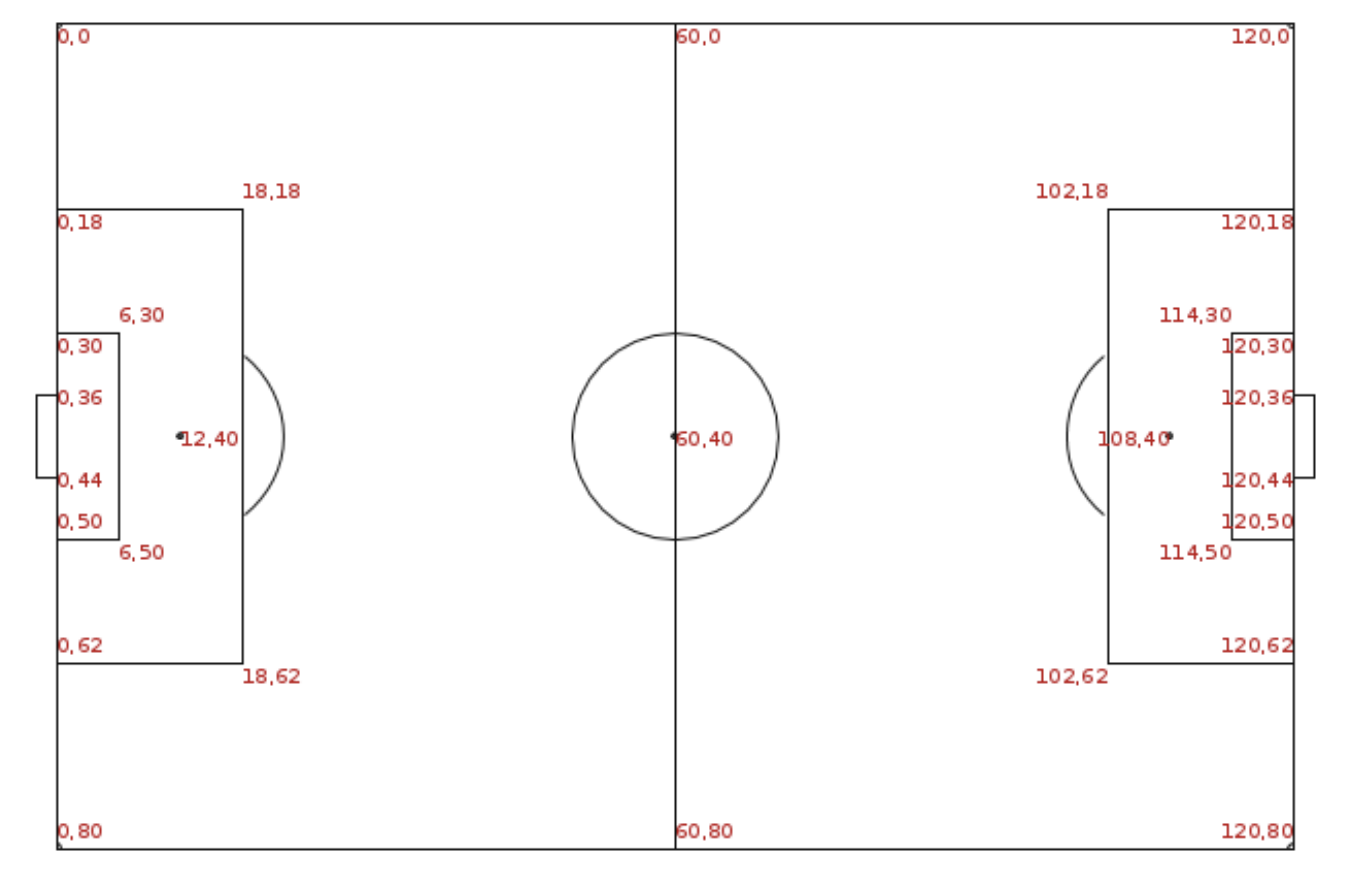
Setting the pitch size to 120x80 will do the job for us.
 const pitchOptions = {
    ...
    height: 80,
    width: 120,
   ...
  };
Plotting passes
A Pass Layer should have the following properties:
- startX - x coordinate of the starting point of the pass
- startY - y coordiante of the the starting point of the pass
- endX - x coordinate of the end point of the pass
- endY - y coordinate of the end point of the pass
Let's create some mock passes to draw on the pitch. X coordinate is the horizontal axes and the Y coordinate is the vertical axis.
const passes = [];
for (let i = 0; i < 10; i++) {
  passes.push({
    startX: Math.floor(Math.random() * 120),
    startY: Math.floor(Math.random() * 80),
    endX: Math.floor(Math.random() * 120),
    endY: Math.floor(Math.random() * 80),
  });
}
Everything above the pitch is a Layer in Rabona. We can add a Pass Layer to the pitch by calling the addLayer method of the pitch. We can create a new layer by calling the layer method of the Rabona object. The layer method takes three arguments:
- type - the type of the layer. In our case it is ballMovement
- options - the options of the layer. Stylistic options like the color of the passes, the width of the passes, etc.
- data - the data of the layer. In our case it is an array of passes
by calling addTo method of the layer we can add the layer to the pitch.
const layer = Rabona.layer({
  type: "ballMovement",
  data: passes,
  options: {
    color: "yellow",
    width: 1.5,
    showArrows: true,
    radius: 3,
  },
}).addTo(pitch);
The result is the following:
Updating React Component
export const PitchComponentWithPasses = () => {
  const [pitch, setPitch] = useState(null);
  const pitchOptions = {
    height: 80, //in px
    width: 120, //in px
    padding: 100, // in px, distance between the pitch border lines and external border
    linecolour: "#ffffff",
    fillcolour: "#7ec850",
  };
  useEffect(() => {
    if (!pitch) {
      const pitch = Rabona.pitch("pitchWithPasses", pitchOptions);
      setPitch(pitch);
      const passes = [];
      for (let i = 0; i < 10; i++) {
        passes.push({
          startX: Math.floor(Math.random() * 120),
          startY: Math.floor(Math.random() * 80),
          endX: Math.floor(Math.random() * 120),
          endY: Math.floor(Math.random() * 80),
        });
      }
      const layer = Rabona.layer({
        type: "ballMovement",
        data: passes,
        options: {
          color: "yellow",
          width: 1.5,
          showArrows: true,
          radius: 3,
        },
      }).addTo(pitch);
    }
  }, []);
  return (
    <div id="pitchWithPasses" style={{ width: "750px", margin: "auto" }} />
  );
};
Adding Labels to the Passes
We can add labels to the passes by adding label property to the data. First let's extend our mock data generator with labels.
const passes = [];
const randomNames = [
  "Messi",
  "Ronaldo",
  "Neymar",
  "Mbappe",
  "Salah",
  "Kane",
  "Suarez",
  "Benzema",
  "Griezmann",
  "Lewandowski",
];
for (let i = 0; i < 10; i++) {
  passes.push({
    startX: Math.floor(Math.random() * 120),
    startY: Math.floor(Math.random() * 80),
    endX: Math.floor(Math.random() * 120),
    endY: Math.floor(Math.random() * 80),
    label: randomNames[Math.floor(Math.random() * randomNames.length)],
  });
}
rest of the code is the same as before. Only difference is that we changed the options layer to enlarge circle radius a bit.
...
const layer = Rabona.layer({
  type: "ballMovement",
  data: passes,
  options: {
    color: "yellow",
    width: 2,
    showArrows: true,
    radius: 20,
  },
}).addTo(pitch);
...
In the next tutorial we will plot the shots on the pitch with different styles for goals and misses.